We remain fully operational. Our teams are working around the clock to ensure your deliveries continue safely.
DOWNLOAD THE APP


Copyright © 2025 Desertcart Holdings Limited
DOWNLOAD THE APP


Buy anything from 5,000+ international stores. One checkout price. No surprise fees. Join 2M+ shoppers on Desertcart.
Desertcart purchases this item on your behalf and handles shipping, customs, and support to Israel.
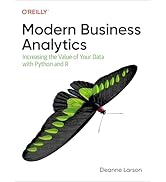
desertcart.com: R for Data Science: Import, Tidy, Transform, Visualize, and Model Data: 9781491910399: Wickham, Hadley, Grolemund, Garrett: Books Review: learning R - As a beginner to R, I bought this book at the recommendation from Data Science for Fundraising: Build Data-Driven Solutions Using R and am so glad that I did. R4DS provides useful content to get started with R. The book consists of 5 main sections: 1. Getting started (Explore) 2. Data manipulation (Wrangle) 3. Scripting (Program) 4. Build models 5. Presenting information (Communicate) Here’s a brief overview of each section: Explore I was a bit puzzled as the book jumps directly into plotting using the ggplot library. Although the authors are clear that the purpose of introducing ggplot is to keep our motivation high, seeing the ggplot syntax without a whole lot of background can be confusing at first. But then the authors do a great job at explaining the various aspects of ggplot. So my advice to other R beginners is to just keep going forward! After the intro to ggplot, you learn about the basics of R, such as variables and functions, as well as intermediate topics such as writing scripts, manipulating data using dplyr, and lastly EDA. This section ends with a good overview of how to use RStudio to saves script files. Wrangle This section starts with an intro to tibbles, which is a new concept for handling data in R. This section is important since most of the functions in later chapters use tibbles, such as reading data from various sources. There are many important concepts that seem useful such as “tidying up” your data and cleaning data points (string and dates). Program This is a function section that introduces data pipes. This section explores how to chain complicated data operations together. You also get to see some good practice in writing human readable code. Then the book jumps into using the power of R as a functional programming language. Once I feel more proficient, I will take a deeper look at purr. Model Now, depending on your situation, you may not be interested in this section, which is focuses on predictive modeling. There are quite a few recipes that explore “why” questions. Definitely planning to come back to this chapter later. Communicate This section is useful because it introduces how to create reusablereports. Overall, this is my go-to book along with the book I previously mentioned. This book is a solid reference book for learning R. Another good thing is that the companion website is regularly updated and you can copy and paste the code examples directly into RStudio. I’m looking forward to further exploring R and learning how to create my own data visualizations. Review: An excellent introduction to using R for Exploratory Analysis. - Wickham and Grolemund have produced an excellent book that would help a beginning R user become very efficient in explanatory analysis. Unsurprisingly the approach that they expound utilises the "hadleyverse" a collection of packages (ggplot2 for visualisation, tidyr for reshaping, dplyr for selecting and filtering, purrr for functional programming, broom for linear models etc) that dramatically speed up most of the common steps involved in an analysis. One benefit of Wickham's involvement in these packages has been a coherent philosophy that sits behind them. It can be a little tricky when learning this philosophy, but the long term benefits are enormous. The book is broken up into a number of sections that effectively builds up the ability to ingest, transform, visualise and model datasets. A good portion of the book is available in an online version, to give you a taste of how it is written. Many have been following it as it was written. I have passed on copies of the book to a number of colleagues who were just starting out and the response has been uniformly positive. In my own case I was familiar with some of the these packages; ggplot2, dplyr, tidyr, but found the book taught me purrr and how to better use the packages together. Probably my two biggest caveats to readers are that there are situations where packages from outside the "hadleyverse" maybe required. The authors do a great job of pointing this out, but it does pay in my experience to know data.table and lattice for example. Both because they can occasionally fit a problem better but also because you inevitably come across other people's code where these packages are used. The other caveat is that the modelling is a little rudimentary. Most of the examples are just fitting independent regression models, whereas it seems to me that a hierarchical model would be a better fit. Still these are small things and it would be silly to expect a single book to cover all of these areas. In short this is the book I would give to someone who was keen to learn about how to use R for data science. It reads really well building up the different components whilst still being a valuable reference if you just need a reminder of a particular package (what is the difference between tibbles and data frames again?). Even though a good portion of the book is available online, it is well worth it to have the full thing on your bookshelf (digital or otherwise). On a broader note with Max Kuhn (author of the excellent "Applied Predictive Modelling" with Kjell Johnson) joining Wickham and Grolemund at RStudio, it is a great time to start your R journey.


| Best Sellers Rank | #250,856 in Books ( See Top 100 in Books ) #23 in Mathematical & Statistical Software #91 in Data Processing #177 in Probability & Statistics (Books) |
| Customer Reviews | 4.7 out of 5 stars 1,632 Reviews |
N**C
learning R
As a beginner to R, I bought this book at the recommendation from Data Science for Fundraising: Build Data-Driven Solutions Using R and am so glad that I did. R4DS provides useful content to get started with R. The book consists of 5 main sections: 1. Getting started (Explore) 2. Data manipulation (Wrangle) 3. Scripting (Program) 4. Build models 5. Presenting information (Communicate) Here’s a brief overview of each section: Explore I was a bit puzzled as the book jumps directly into plotting using the ggplot library. Although the authors are clear that the purpose of introducing ggplot is to keep our motivation high, seeing the ggplot syntax without a whole lot of background can be confusing at first. But then the authors do a great job at explaining the various aspects of ggplot. So my advice to other R beginners is to just keep going forward! After the intro to ggplot, you learn about the basics of R, such as variables and functions, as well as intermediate topics such as writing scripts, manipulating data using dplyr, and lastly EDA. This section ends with a good overview of how to use RStudio to saves script files. Wrangle This section starts with an intro to tibbles, which is a new concept for handling data in R. This section is important since most of the functions in later chapters use tibbles, such as reading data from various sources. There are many important concepts that seem useful such as “tidying up” your data and cleaning data points (string and dates). Program This is a function section that introduces data pipes. This section explores how to chain complicated data operations together. You also get to see some good practice in writing human readable code. Then the book jumps into using the power of R as a functional programming language. Once I feel more proficient, I will take a deeper look at purr. Model Now, depending on your situation, you may not be interested in this section, which is focuses on predictive modeling. There are quite a few recipes that explore “why” questions. Definitely planning to come back to this chapter later. Communicate This section is useful because it introduces how to create reusablereports. Overall, this is my go-to book along with the book I previously mentioned. This book is a solid reference book for learning R. Another good thing is that the companion website is regularly updated and you can copy and paste the code examples directly into RStudio. I’m looking forward to further exploring R and learning how to create my own data visualizations.
S**S
An excellent introduction to using R for Exploratory Analysis.
Wickham and Grolemund have produced an excellent book that would help a beginning R user become very efficient in explanatory analysis. Unsurprisingly the approach that they expound utilises the "hadleyverse" a collection of packages (ggplot2 for visualisation, tidyr for reshaping, dplyr for selecting and filtering, purrr for functional programming, broom for linear models etc) that dramatically speed up most of the common steps involved in an analysis. One benefit of Wickham's involvement in these packages has been a coherent philosophy that sits behind them. It can be a little tricky when learning this philosophy, but the long term benefits are enormous. The book is broken up into a number of sections that effectively builds up the ability to ingest, transform, visualise and model datasets. A good portion of the book is available in an online version, to give you a taste of how it is written. Many have been following it as it was written. I have passed on copies of the book to a number of colleagues who were just starting out and the response has been uniformly positive. In my own case I was familiar with some of the these packages; ggplot2, dplyr, tidyr, but found the book taught me purrr and how to better use the packages together. Probably my two biggest caveats to readers are that there are situations where packages from outside the "hadleyverse" maybe required. The authors do a great job of pointing this out, but it does pay in my experience to know data.table and lattice for example. Both because they can occasionally fit a problem better but also because you inevitably come across other people's code where these packages are used. The other caveat is that the modelling is a little rudimentary. Most of the examples are just fitting independent regression models, whereas it seems to me that a hierarchical model would be a better fit. Still these are small things and it would be silly to expect a single book to cover all of these areas. In short this is the book I would give to someone who was keen to learn about how to use R for data science. It reads really well building up the different components whilst still being a valuable reference if you just need a reminder of a particular package (what is the difference between tibbles and data frames again?). Even though a good portion of the book is available online, it is well worth it to have the full thing on your bookshelf (digital or otherwise). On a broader note with Max Kuhn (author of the excellent "Applied Predictive Modelling" with Kjell Johnson) joining Wickham and Grolemund at RStudio, it is a great time to start your R journey.
X**3
Great book - Very useful!
I am very happy with this book. Its easy to read and the exercises/code work and are applicable. The text is clearly written and the supporting graphics are well constructed. I have started working through some of the exercises in R and find them very helpful. I bought this book after completing a graduate course in data analysis using R. Much of the course was constructed around Hadley Wickham's work. We used ggplot2 and tidyverse extensively. We did not use this book in the course and I now wish we had used it as a desk reference. This book is answering many of the questions I had. It is also providing an overview of many basic concepts and tools in R and would have been helpful to have at my fingertips during my graduate course. Google is a great resource, but a well written and easily sourced desktop resource like this is indispensable. I am learning something new about R constantly...I would consider myself a late beginner to early intermediate user of R for data science/data analysis. I often find books that cover the basics extremely useful, because its easy to forget. So for me, this was a good buy - regardless of my skill level. Others will have to make their own decision. This book does not cover mapping in R. In fact, there is a sentence in Chapter 1 that states - this book does not cover mapping. I would like to have had more on that topic or a follow-up book committed to mapping and integration with other tools like Leaflet or ArcGIS.
C**W
Good content, but print quality is so-so
To anyone who may be unaware, all of the contents of the book are available for free online and are updated regularly. I purchased this book in October 2019 and it was already out of date compared the the version online. However, not enough out of date to deter me from using it. I prefer to read books in print versus online, which is the main reason I purchased this book. It also allows me to study while on a plane, which is very convenient. The book is great, easy to understand, and provides a lot of questions and examples to work through in each chapter. I’m halfway through the book now, and one complaint that I have is that the quality of the print leaves a bit to be desired. If you look at my photos, you’ll see that I drew boxes around certain words/letters. I had to do this because the printed lines were SO faint that I completely missed it the first time I read it. This made the chapter more confusing than it should have been. I had to reread it a few times before I made out the super faint boxes. I compared it to the online version, which had the lines/boxes clearly drawn. I also wish the solutions to the practice questions and exercises were printed in the book so that I could check my answers. However, the answers are available online...it just adds a bit of unnecessary hassle. Those are really my only complaints so far. Overall, good book for beginner R and data science learners.
C**T
Great, easy-to-follow book for mastering how to work in R
If you are going to be using R extensively, you'll want to dive into this book and get yourself set up to work efficiently and quickly in R. It covers all the things you need to know about working in R and RStudio EXCEPT for the stats and analysis part. You learn about getting data in, cleaning the data up (because who is ever given a clean dataset to start with?), exploring and organizing your data, a quick primer on ggplot2 (you'll want the R Graphics Cookbook for the full story), how to work with dates, different variable types, and write your own functions. RStudio is more than just a coding environment - it's got all sorts of features to get you from code to interactive web graphics (shiny), practically self-writing results (knitr), and even something akin to a live lab notebook (R notebooks). This book walks you through setting those up, as well as touches on finer points of things like vectors, models, and automation. It's written at a level understandable to laypeople with a bit of coding experience, but doesn't assume you are a pro. Hadley does a fantastic job of pointing out potential stumbling blocks where some functions might give you unexpected results. If you can stumble through doing your stats and making a few graphs in R, then this book is your next step to being a professional R user.
J**B
This might be the best (NON-Fluff) Data Analysis book out there
I think this book is a perfect blend of technical training, visual reporting, sample datasets and clear communication. The authors teach concepts in small chunks of code, and the code is pretty easy to interpret I will also be honest, it took me a few months of playing with “R” to get to a point where the syntax made sense(im still learning). Im at the point, where i can read each chapter and im NOT getting confused at any of the topics(through chapters 1-5 so far). Im really starting to feel confident enough to take the breakthroughs to develop solutions that will be able to use at work very soon(maybe in a month or so) I had invested several years into Python and its great but my company locks python down but leaves R completely open (probably concerning the kernal access). So i had to switch to R from scratch. The transition was intimidating at first, but i plugged away and got the basics on my own. Now im somewhat confident about subsetting, db connections, dataframes, ggplot and dplyr. Im looking forward to defining functions and proc+packages in the near future. I really have to commend Hadley and the Grolemund for putting together a VERY DIGESTIBLE book. The book is long, but it is easy to follow. I bought the physical copy and im so happy, i bought the digital copy(hard to find) Thanks, Chris Buck
M**O
Great book, but beginners beware
It's a great book to learn at your own pace the basics of data science and data manipulation with R, and I would recommend to anyone to buy it. The authors are precise and clear in the explanations. Just one comment: if you are a beginner with the language, you will have a harsh time going through the book. In the first 2 sections, where the authors explain ggplot and dplyr, if you don't know the grammar of the code you will certainly get frustrated because there is no explanation of the basics. They just start with the ggplot code and take off. The same occurs with the dplyr chapter. They teach you how to use the functions filter(), arrang() and so on, but don't show you the basics of R. My advice is to read other sources to get a basic understanding of R and its grammar, and then get this book. Also I would like to point out that the printed version has some serious typos, missing graphs, incomplete diagrams and some datasets are not fully printed on the page, so sometimes the authors try to show you something on a new variable added to the original dataset, but it doesn't appear on the page,,,,
H**H
Learn R the Right Way
As a college student trying to learn R without any programming background, I often found the materials suggested by professors to be confusing and boring. I tried online courses, textbooks, and video tutorials, but still struggled to grasp important concepts. Finally, at the recommendation of a potential employer I gave Wickham's R for Data Science a try. He strongly recommended the book for both beginners, as well as intermediate R users looking to sharpen their skills. Unlike other books I had used previously, Wickham's explanations were concise, clear, and interesting. He teaches important fundamentals of the language, without overwhelming newcomers to R. Wickham's explanations are always accessible, even for those without programming experience. Hadley Wickham is practically a celebrity in the R community, and for good reason. He has developed many of the best packages in use. And unlike many experts, he is very conscious about teaching in a way that anyone can understand. Before you give up on learning R, I would definitely recommend giving this book a try. Note: The book is available for free on the author's website. However, I prefer to have a physical copy and have been pleased with the quality.
Trustpilot
1 month ago
2 months ago